My Proximity Graph Generator
A Node in the Road
During a data mining course (yes, that is one of the reasons excuses that I’ve not posted anything in a while) that I’ve recently finished, I was introduced to a concept that was new to me that I found rather interesting. Not only was the concept new and had many different facets to learn about, but it also involved a large amount of programming time. So, I thought that using some of these learnings would make for an interesting (hopefully) post or two and one that would also include some much needed programming content for here as well. So, without further ado, lets talk about proximity graphs.
Proximity Graphs
A Proximity Graph is a type of graph that is used to express complex algorithms or relationships that can be defined by, you’ve guessed it: proximity. These graphs are a tool that is used in data mining and can be represented in a number of different ways and by a number of different software applications.
I’ve used graphs as a visualisation tool previously, however, learning about proximity graphs was an interesting turn in my data science studies. As a proximity graph is focused on the connections between points it is not necessarily defined by positions on an axis, but potentially by reference to other points on the graph. What I mean by this is that each point on a proximity graph often isn’t specifically tied to that location (think x and y axis), but it is tied to its proximity to other nodes that it might be attached to.
The below image shows an example of a proximity graph. This graph shows each of my blog posts to date (labelled by date published) and any references that exist between them.
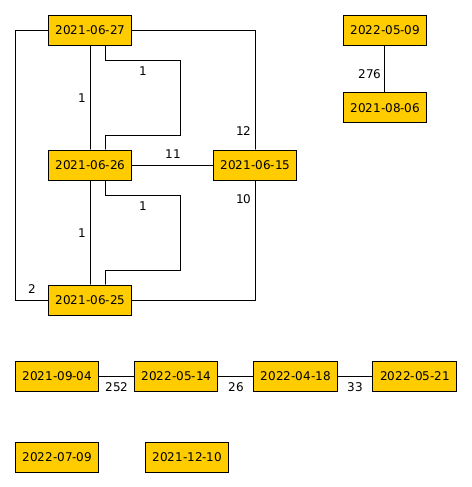 Proximity Graph example
Proximity Graph Components
A proximity graph is made up of three main components:
- Nodes: These represent individual rows of data in a table, people, blog posts, basically any reference point within a dataset
- Edges: These represent a connection between two nodes and might have a direction, weight or other attribute describing the link
- Weights: These represent the ‘proximity’ between nodes of the graph and can be calculated in a number of different ways
The edges and edge weights between nodes are where the data mining techniques come in to play (I’ll show some more examples of these in future posts) and are usually determined based on an algorithm or calculation. In the above example, the weights associated with the edges represent the number of days between a post. This isn’t necessarily useful information or a good use of a proximity graph but, maybe in the future I’ll revisit this and if there’s anything that could be learned from this.
Graphing the Data
A proximity graph is clearly easier to represent visually than it might be to describe with words, and there are a number of different formats suited to this task. One such format is ‘gml’ or ‘Graph Modelling Language’ described here: https://hwiegman.home.xs4all.nl/fileformats/gml/gml-tr.html. This format was developed to provide a simple method for describing graphs as a set of nodes and edges and, since it’s an open format, one that is easily interpreted by a number of different applications.
To, finally, bring some programming into this post, the below is my version of a Python gml generator. The output gml file of this is shown below the code and the yEd graph editor was used to display and export the proximity graph example shown above.
GML Output
The Python code below can be read easily and it is relatively easy to see how a graph is put together using this gml format. There’s a number of additional options and syntax that can be added to this file format, but the example below is on the minimal side.
I’m not convinced that the ‘directed’ parameter is used correctly by yEd, as I had to add in the ‘graphics’ part of the gml output to specify that the edges were to be ‘lines’ rather than the default ‘arrow’ indicating directionality, which isn’t always true/representative. This could just be a yEd option though, I’d never used the software until starting this course.
Proximity Graph Examples
There a huge number of different applications of proximity graphs, and that’s excluding the many, many, different algorithms that are used with them to produce insights into data. However, whilst writing out this post in Obsidian, I realised that one example had been staring me in the face since I first learned about them: Obsidian’s Graph View. This is a view of all selected notes in your vault with links between them.
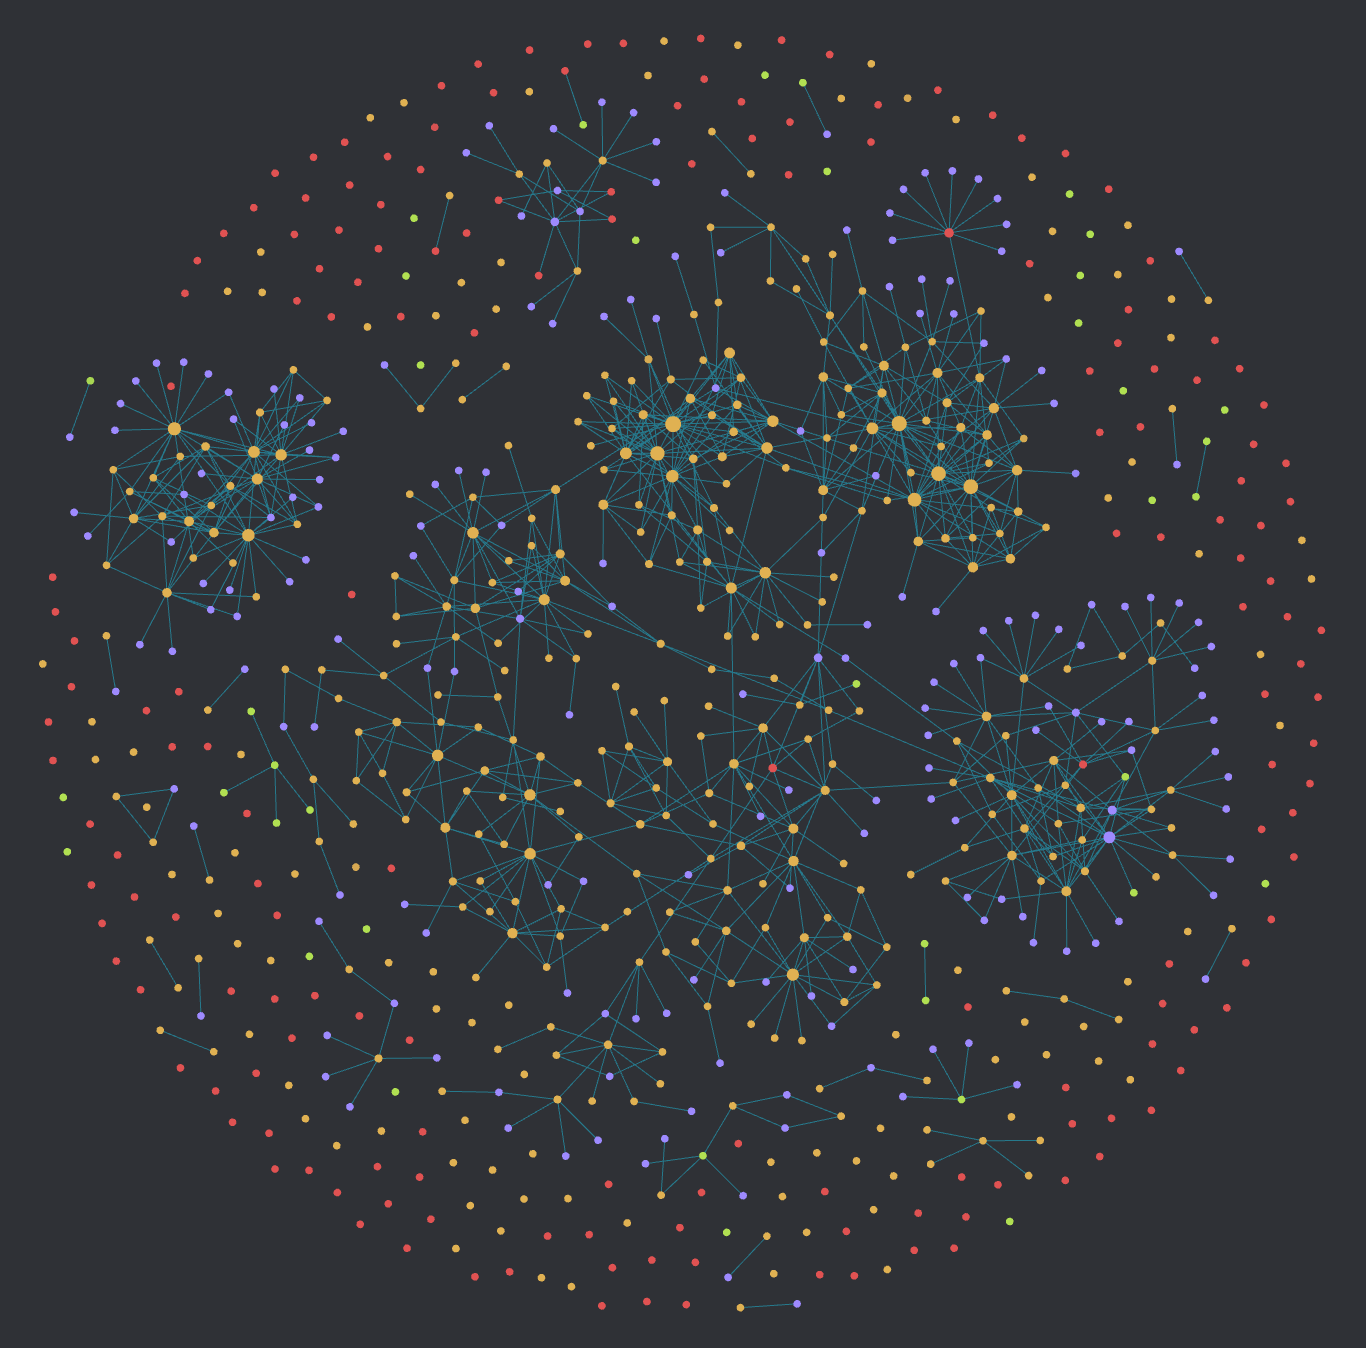 Obsidian Graph View
When I get around to writing the next post about this topic (spoiler alert: It’s Minimum Spanning Trees) I’ll include some more examples and maybe try to prepare some data beforehand to demonstrate the process and uses of them.
output_gml.py
# Class to output a gml file

class GmlOutput:

    def __init__(self, graph_name, vertices, edges,
                 hierarchic=1, directed=0, vertex_labels=[], edge_labels=[], debug=False):
        self.graph_name = graph_name
        self.vertices = vertices
        self.edges = edges
        self.hierarchic = hierarchic
        self.directed = directed
        self.vertex_labels = vertex_labels
        if len(self.vertex_labels) == 0:
            for vertex in vertices:
                self.vertex_labels.append(f'{vertex}')
        self.edge_labels = edge_labels
        if len(self.edge_labels) == 0:
            for edge in edges:
                self.edge_labels.append(f'{edge[2]}')
        self.debug = debug
        self.indent = "    "

    def output_gml(self):
        # Write initial graph data
        file = open(f'{self.graph_name}.gml', 'w')
        file.write('Creator \"Your name here\"\ngraph\n[\n')
        file.write(f'{self.indent}hierarchic {self.hierarchic}\n')
        file.write(f'{self.indent}label \"{self.graph_name}\"\n')
        file.write(f'{self.indent}directed {self.directed}\n')

        # Write nodes
        for i, vertex in enumerate(self.vertices):
            file.write(f'{self.indent}node\n')
            file.write(f'{self.indent}[\n')
            file.write(f'{self.indent}{self.indent}id {vertex}\n')
            file.write(f'{self.indent}{self.indent}label \"{self.vertex_labels[i]}\"\n')
            file.write(f'{self.indent}]\n')

        # Write edges
        for i, edge in enumerate(self.edges):
            file.write(f'{self.indent}edge\n')
            file.write(f'{self.indent}[\n')
            file.write(f'{self.indent}{self.indent}source {edge[0]}\n')
            file.write(f'{self.indent}{self.indent}target {edge[1]}\n')
            file.write(f'{self.indent}{self.indent}label \"{self.edge_labels[i]}\"\n')
            file.write(f'{self.indent}{self.indent}graphics\n')
            file.write(f'{self.indent}{self.indent}[\n')
            file.write(f'{self.indent}{self.indent}{self.indent}type "line"\n')
            file.write(f'{self.indent}{self.indent}]\n')
            file.write(f'{self.indent}]\n')

        # Write end of file and close
        file.write("]\n")
        file.close()


# Called if the script is run as the main
if __name__ == '__main__':

    # Instantiate the Graph object with the number of vertices
    # and specify if debug is True or False
    test_vertices = [0, 1, 2, 3, 4, 5, 6, 7, 8, 9, 10, 11]
    test_vertex_labels = ['2021-06-15', '2021-06-25', '2021-06-26',
                          '2021-06-27', '2021-08-06', '2021-09-04',
                          '2021-12-10', '2022-04-18', '2022-05-09',
                          '2022-05-14', '2022-05-21', '2022-07-09']
    test_edges = [(1, 0, 10), (1, 2, 1), (2, 0, 11), (2, 1, 1),
                  (2, 3, 1), (3, 0, 12), (3, 1, 2), (3, 2, 1),
                  (8, 4, 276), (9, 5, 252), (9, 7, 26), (10, 7, 33)]
    test = GmlOutput("test", test_vertices, test_edges, debug=True,
                     vertex_labels=test_vertex_labels)
    test.output_gml()
output_gml Output
The output the above Python file (if called as ‘main’ is:
Creator "Your name here"
graph
[
    hierarchic 1
    label "test"
    directed 0
    node
    [
        id 0
        label "2021-06-15"
    ]
    node
    [
        id 1
        label "2021-06-25"
    ]
    node
    [
        id 2
        label "2021-06-26"
    ]
    node
    [
        id 3
        label "2021-06-27"
    ]
    node
    [
        id 4
        label "2021-08-06"
    ]
    node
    [
        id 5
        label "2021-09-04"
    ]
    node
    [
        id 6
        label "2021-12-10"
    ]
    node
    [
        id 7
        label "2022-04-18"
    ]
    node
    [
        id 8
        label "2022-05-09"
    ]
    node
    [
        id 9
        label "2022-05-14"
    ]
    node
    [
        id 10
        label "2022-05-21"
    ]
    node
    [
        id 11
        label "2022-07-09"
    ]
    edge
    [
        source 1
        target 0
        label "10"
        graphics
        [
            type "line"
        ]
    ]
    edge
    [
        source 1
        target 2
        label "1"
        graphics
        [
            type "line"
        ]
    ]
    edge
    [
        source 2
        target 0
        label "11"
        graphics
        [
            type "line"
        ]
    ]
    edge
    [
        source 2
        target 1
        label "1"
        graphics
        [
            type "line"
        ]
    ]
    edge
    [
        source 2
        target 3
        label "1"
        graphics
        [
            type "line"
        ]
    ]
    edge
    [
        source 3
        target 0
        label "12"
        graphics
        [
            type "line"
        ]
    ]
    edge
    [
        source 3
        target 1
        label "2"
        graphics
        [
            type "line"
        ]
    ]
    edge
    [
        source 3
        target 2
        label "1"
        graphics
        [
            type "line"
        ]
    ]
    edge
    [
        source 8
        target 4
        label "276"
        graphics
        [
            type "line"
        ]
    ]
    edge
    [
        source 9
        target 5
        label "252"
        graphics
        [
            type "line"
        ]
    ]
    edge
    [
        source 9
        target 7
        label "26"
        graphics
        [
            type "line"
        ]
    ]
    edge
    [
        source 10
        target 7
        label "33"
        graphics
        [
            type "line"
        ]
    ]
]